
All the Python scripts for this project can be found here
For the entire analysis, IC final report is available here
Instacart is an online grocery store that operates through an app. Although the company already has very good sales, they want to learn more about their sales patterns. They aim to target different customers with relevant marketing campaigns to test if it impacts product sales.
This analysis aims to assist in targeting the right customer profiles with the right products.
The dataset for this project is open-source and can be downloaded here. The Data Dictionary is available here.
I modified the original data sets by removing missing values and duplicates. After that, I merged several datasets into a complete final dataset with a total of 32.404.859 records. The population flow above shows all this process, where the gray boxes in the first row represent the original datasets and the colored boxes in the second row.

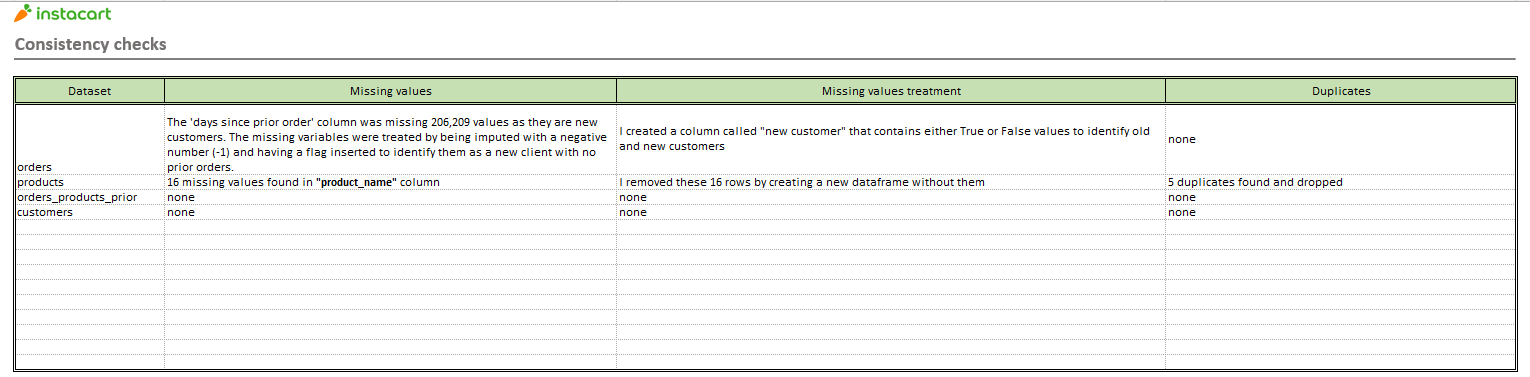
During this initial step, I worked on three distinct data sets (orders, customers, and products). I made sure that the data was formatted consistently, that there were no duplicates, and that all missing values were properly handled.

The Excel report documents all data wrangling and consistency checks performed to ensure data integrity.
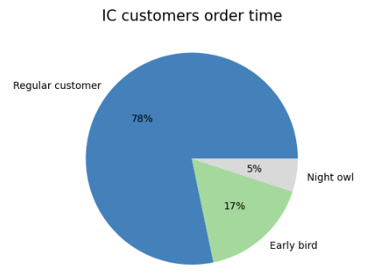
I created several flags to identify the busiest days of the week, along with new columns to show the results. IC customers have clear shopping preferences in terms of days and hours.
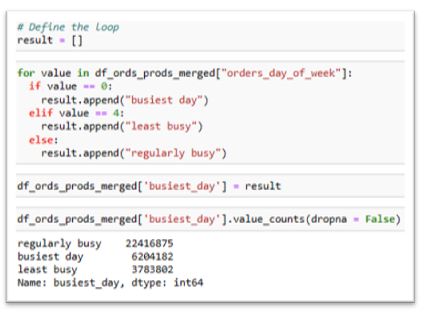
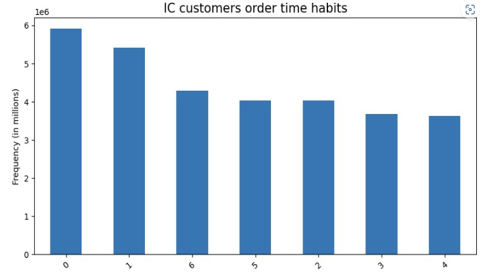
The visualizations below show that Saturdays and Sundays are the busiest days of the week and that IC customers often place their orders throughout the day; in fact, most of the orders are placed between 10 a.m. and 4 p.m.
Please keep in mind that the days are represented numerically, with 0 being Saturday and 6 representing Friday.
Furthermore, most of the products sold on IC cost less than $15.

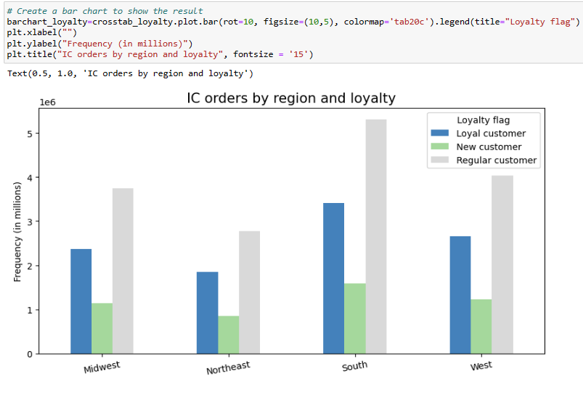
I divided IC customers into different categories, as shown by the charts, based on their loyalty status, shopping habits, age, income, and region. As we can see from the charts below, the most devoted IC customers are regular customers living in the southern regions.
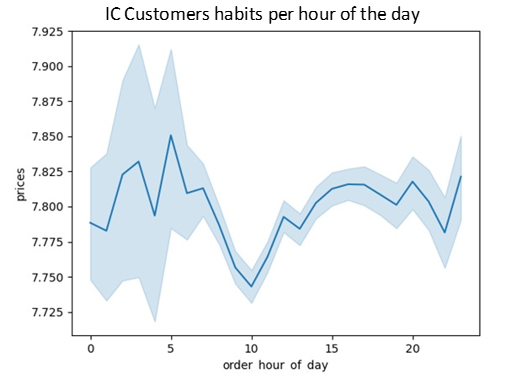
The visualization below shows that more expensive products are purchased throughout the night, whereas less expensive items are purchased in the morning.
Although this segmentation provided very useful insights, shopping habits appeared to be pretty similar across the various consumer profiles; thus, I would advise IC to start generic marketing focused on the product rather than profiling customers.
Saturday and Sunday are the busiest days of the week, while the busiest time of day to place an order is between 10 a.m. and 4 p.m. The night is when people buy more expensive items, whereas less expensive products are purchased in the morning. Because of this, I would suggest advertising more expensive goods from Sunday to Thursday during the slowest times of the day (20 p.m.–9 a.m.).
Because IC clients mostly buy alcohol, dairy, eggs, snacks, and beverages, it is essential to keep appropriate stock levels in these product categories. Additionally, the majority of products sold on IC cost less than $15; therefore, I wouldn't advise promoting more expensive goods.
Couples with kids, particularly small families (1-2 children), are the most loyal clients; thus I would recommend the sales and marketing teams to focus on this market. Furthermore, Instacart has the largest customer base in the southern regions. For this reason, new products and brands could be launched there, while IC should focus on growing in the rest of the country.

